- InvestiBrew
- Posts
- 🗞 Open For 62% Profit Potential
🗞 Open For 62% Profit Potential
This trade is ready to go. Will you join us this time?
Offside Capital
August 11, 2025

WHILE YOU POUR THE JOE… ☕️

Most of you would take this table at face value.
Overvalued industries are supposed to come down, and undervalued ones are supposed to go up, right?
Wrong. 👀
The speed of information spread is fiercer than ever now, and AI is only accelerating the way trading research gets done.
This isn’t new. I saw decades of data put together into a factor model at Goldman Sachs, and there’s a reason they always buy the most expensive and short the cheapest.
Not momentum, but figuring out the reasons why these are trading there (something AI can’t do).
You shouldn’t be surprised to see our $XLI Industrial longs beat the S&P 500 by 2X over the past 6 months while our housing shorts also played out (see them in the table above). 🔥
All I can say is that every day you see evidence like this and not act, it will cost you twice as much when you do decide to take the first step.
Let’s save you some time and losses, join our flagship program The Sovereign Trader to be on Wall Street’s side more often. ✅
Speaking of being on Wall Street’s side, let’s get on with today’s email 📧…
BEAN COUNTERS
Last Check Before Takeoff
By now, we’ve covered the following in our past newsletter series: ⬇️
Where and why we expect the next market move to be (with real data in this post)
Turned that insight into top industry picks for expected volatility and EPS expansion (using zero chart patterns in this post)
Then we honed in on our proprietary stock selection process (and found a high-probability trade in this post)
Now it’s time for the next phase of this trade checklist, the one that gives us a narrative to look after as we execute and manage this idea for the next 20-60 days.
And it’s all in the financial profile of these stock picks:
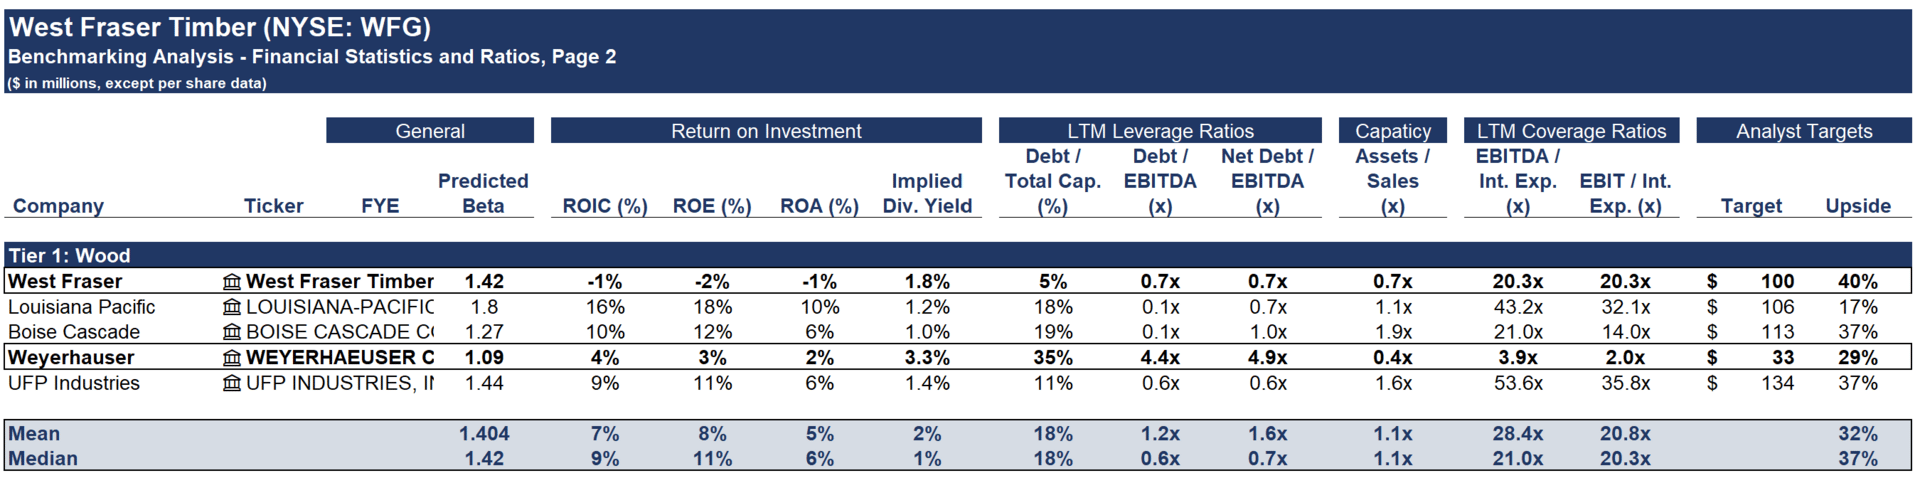
At first glance, our long pick in $WFG doesn’t look all that great compared to peers when it comes to ROIC and ROE.
But,
Here are two metrics I found interesting, and ones that may support the entire buy thesis in themselves:
Debt profile is only 5% of its balance sheet, compared to an average 18%
Capacity is operating at only 70%, the average is 110%
This tells me that West Fraser could now take on more debt when the time is right (lower rates) in order to ramp up its expansion cycle and kick that capacity rate higher.
That means higher EPS. 📈
And if you remember, this is the premium stock in the peer group, now we know why.
Tariffs & West Fraser Stock

Trump is playing tariff war with Canada, we all know that.
But, here’s an interesting indicator when it comes to lumber and Canadian wood in general (where $WFG sources most of it):
Section 232 is an investigation into whether Canadian imports represent a national security threat in the United States, subject to more tariffs
Unless Canadian wood suddenly comes attached with bombs or bioweapons, this likely won’t be the case, so further tariffs on Canadian wood are off the table for now.
That means the market might be onto something by paying so much for this stock 👀…
Before we get into the next major metric on our $WFG long..
A word from yours truly.
10 years ago, I was probably where you are right now:
Scrolling X and other sources for ideas
Only making sense of a trade through the charts
Swinging options with no idea how to manage position size or hedging
Then I got to digging into how Wall Street banks and hedge funds made it all happen.
The result? ⬇️
I landed on a strategy that outperforms all others over time: Long/Short.
And that is exactly what we’ve been covering in this newsletter series, I hope you can see the value thus far into it.

Last but not least, we have Capital Expenditures (CAPEX) on West Fraser Co.
Capital-intensive stocks like this one have a spending cycle, and it looks like West Fraser has already gone through it, as shown in the 70% capacity utilization rate we already mentioned.
This means a direct tailwind for its EPS figure, as less spending is now required to take on the demand cycle that is around the corner (especially on data center construction). 📈
One Reason is Enough: Short $MT
Three regions with which Trump is playing hardball when it comes to tariffs:
Brazil
EU
India
And guess where most (> 75%) of $MT sales come from?
That’s rhetorical, you don’t have to answer that.
That means a massive tail risk for the company’s EPS, which is why analysts expect a 9% decline over the next year, and why the market is discounting the stock right now.
Reality check incoming, 62% upside locked in 🎯
Now remember the chart from the last newsletter:

You will chart: WFG - 1.106 * MT
Entry: $30
Exit: $48.6
Implied upside: 62% 🔥
Join all the other Sovereign Trader Alumni for ideas like these on a weekly basis, and be part of this unique remote hedge fund community.
To your success,
G 🫰
GO AND MAKE IT HAPPEN
Recap
I tried to make this as visual as possible for those visual learners in the audience.
However, I know this is likely not enough to make it stick.
Which is why I am referring you to our YouTube video breaking down another long/short idea.
This one may pay off as soon as next week (when $ONON reports earnings), $BOOT already reported and came crashing down as our short pick.
So I guess kudos to us. 🥳
To your success,
G. 🥃